Description
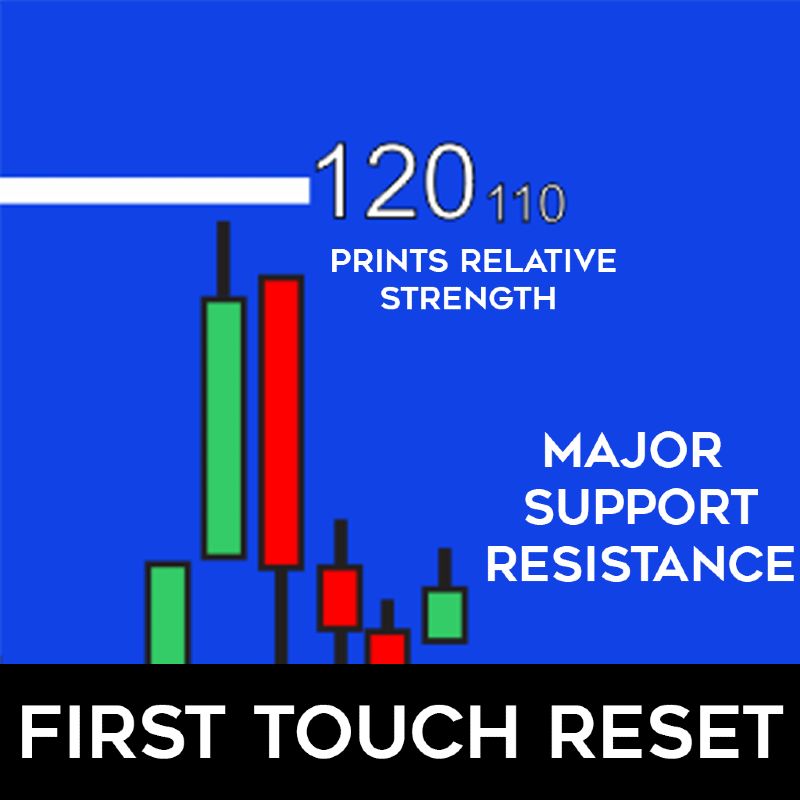
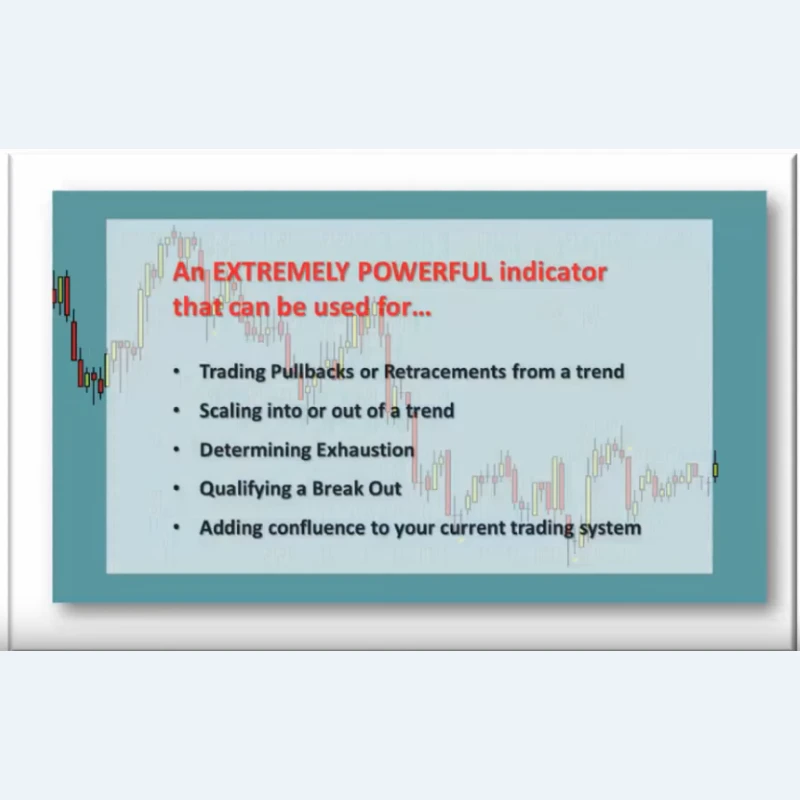
After thousands of hours of working on trading, trading strategies, and trading indicators, you begin to notice certain things. That is how we came up with the First Touch trade setup. We noticed that if price had not touched our support or resistance lines during the trading session or in a relatively long period of time, we were very likely to get a rebound or "bounce" off of the line the very next time we hit it. Without having the charts zoomed out far enough to see when price touched that S/R line or zone, we really had no idea how long it had been or how strong the line was likely to affect price. Once we applied our relative strength indicator at the leading edge of the line, we no longer needed to zoom out or take our eyes off of the current bar to help us make a trading decision. All the information was exactly where we needed it.
Highlights:
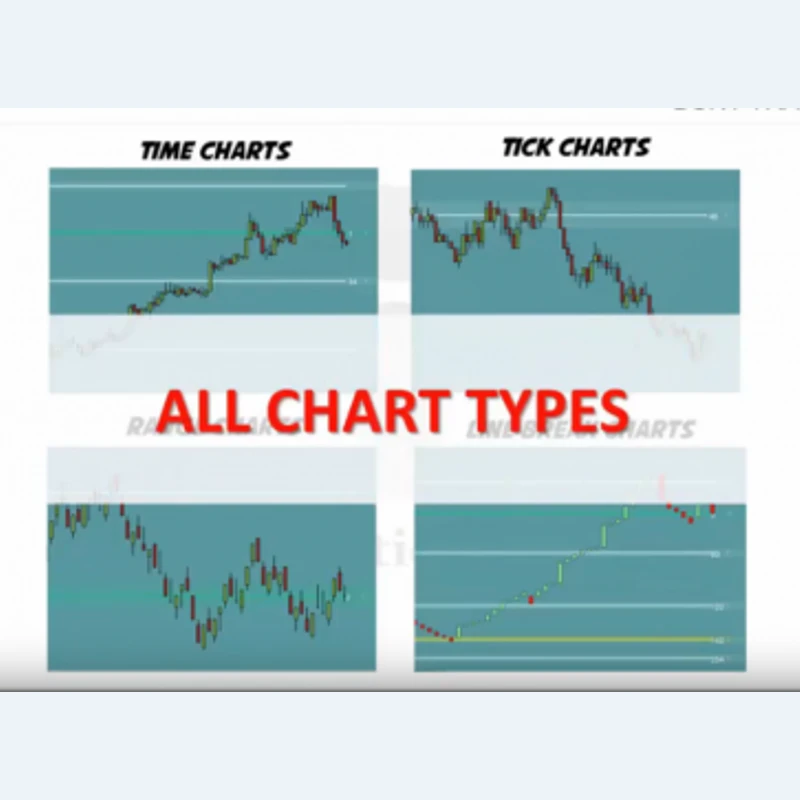
- Add to any chart or time frame
- Assign line color, style, and size
- Show S/R midpoints
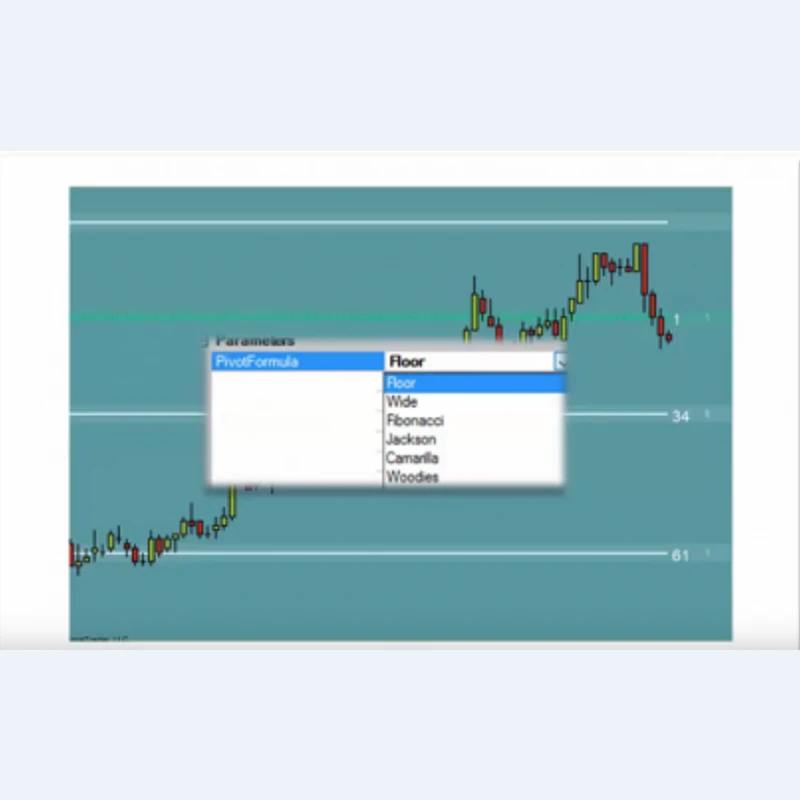
- Customizable line calculation input values
- Toggle on/off
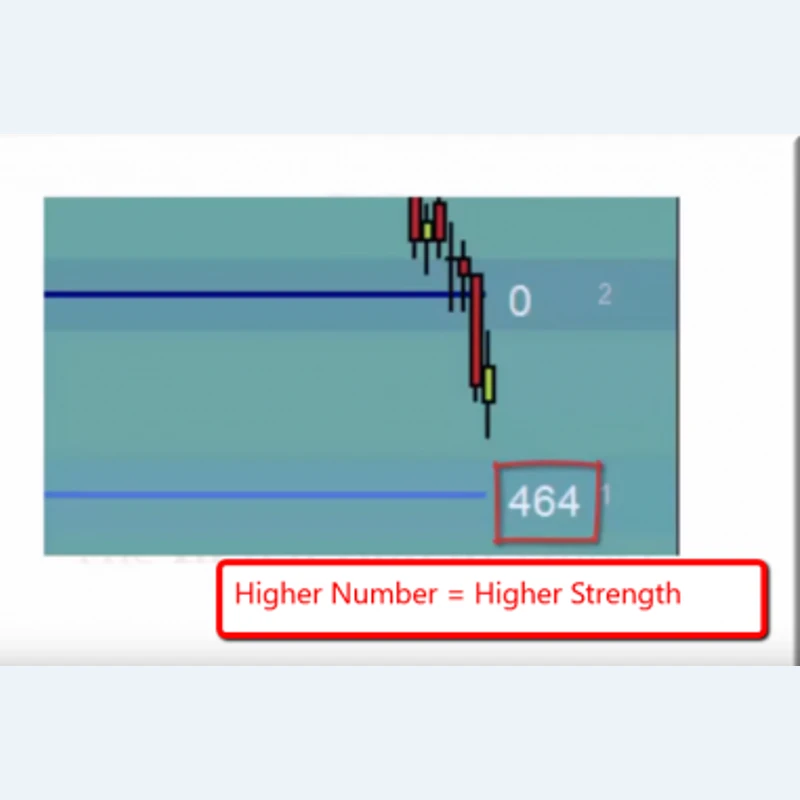
- Relative Strength Indicated
- User configurable support and resistance zones


John –
I am constantly amazed how often the market respects the FT line whether as support or resistance. I couldn’t trade without it.
Bill H –
I like being able to change the color of individual S&R lines, I like to see yesterday’s close, high, and low. I still fiddle with which calculation to use as I see different pivot points calculated in other places, TOS for instance. But it’s easy to set it to match the ones in the IT trade room. The length of time since the line was last touched is a great addition. A great reminder when some price is banging at the screen door like a fly, right Tony? 😉
Brent –
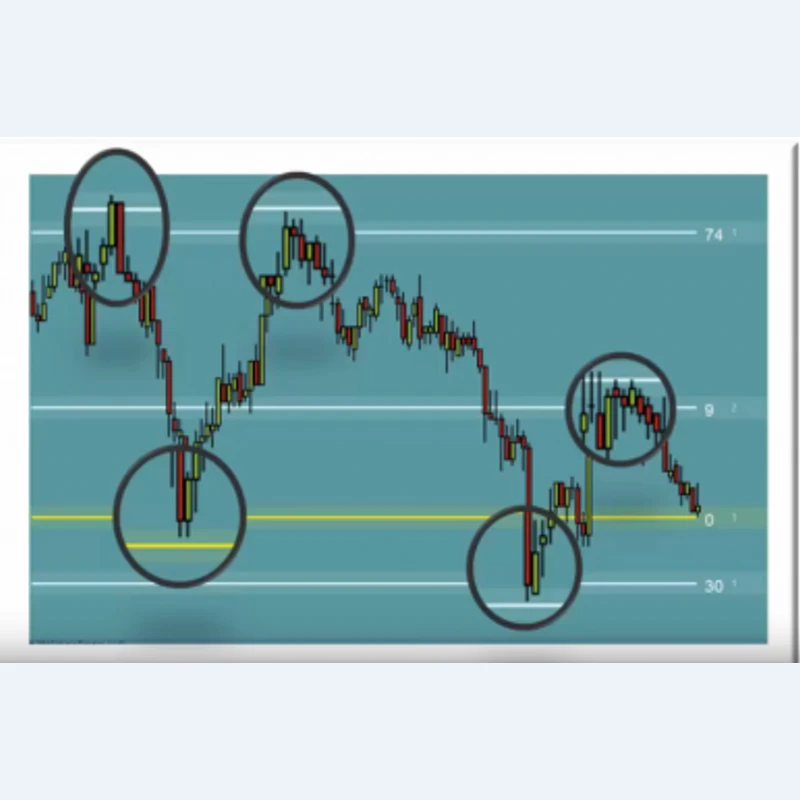
All it takes to recognize the significance of these lines is to go back and look at any trading morning and notice all the places where price halted, got hung up around or completely reversed from and see how often that happened around where these lines are. Trading pullbacks without this indicator is like flying blind; they are the base of my best setups.
Christopher Morrill –
I would not trade without this indicator
Bill M –
Great!
Mike C –
I don’t trade the First Touch setup, but the numbers still give me an indication on the strength of support/resistance.
John Vn –
Takes practice but it’s worth it
Derek –
I’ve seen how the lines are respected
Traderjoe –
Good
Brett –
Been looking for this type of Support and Resistance information
Don –
Great supporting indicator
Sam –
Love it & use it
Mark F –
Excellent
William C –
Extremely accurate
Dave R –
Fantastic indicator of support and resistance,
SP –
I wouldn’t trade without the FT reset lines
John A –
nice
Keith –
The First Touch Reset pivots are something I have not seen before. Knowing how long it has been (in seconds) since price has touched pivot lines has definitely added to my edge in trading.
Ibe –
Fantastic
Ralph L –
Don’t use much because it tends to cause problems with some non IT products I use.
Abby –
5 out of 5
Bob R –
Need to know the rules of use. Tricky for the novice.
Robert S –
im very selective on my FT trades. usually i have winners, now that i refined the skill
Milby P. –
An extremely valuable S/R tool
Chris M –
Love this indicator
Eric I –
One of the best indicators for support and resistance
Alex B –
5 stars
Carlton –
Good, but you’re never quite sure how much weight to give it – but it helps when combined with other indicators.
John D –
5 stars
Ralph L –
3 stars
Eric I –
4 stars
Bill M –
OK Connor, It’s hard to give a grade to something that is one of the core indicators of the system!
Graham K –
Major pivot lines for potential reversals
Christopher F –
5 stars
Matthias –
2 stars
Alan R –
5 stars
Mark –
4 stars
Michael W –
5 stars